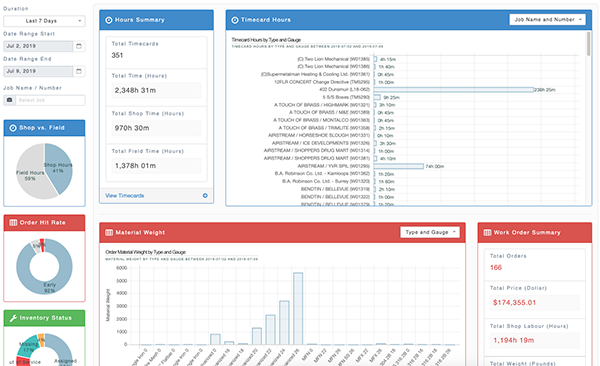
In the information age data is the new “gold mine” from which contractors extract cost and time savings from their field and shop operations. Getting timely and accurate data can reduce waste and improve margins for big and small projects alike. Today, many companies look to data visualization tools such as PowerBI and Domo to aggregate data and report on specific areas of their operations. While BuildCentrix supports and uses data visualization tools, we know not everyone has the time and resources required to implement these complex tools. We also know there are times when real-time interactive mobile reports provide users the information they need to quickly focus on urgent areas of operation that need attention.
This month, our development team is releasing a new reporting dashboard to help users see what’s happening in the shop and field as well on specific jobs and phases. For the first iteration we’ve included these basic reports, which can be filtered by date range and job or project.
• Material weight by type and gauge
• Shop hours by job and labor code
• Field hours by job and labor code
• Order delivery “hit” rate
• Tool tracker summary

Our goal with dashboard reporting is to provide a basic set of generic reports our clients can use to find areas of improvement and cost savings. Once we get more client feedback we’ll add more reports and further functionality such as a CSV download option for all reports. Anyone using PowerBI, Domo, or other data visualization can use our generic dashboard reports and access a full data set through our public API.
The reporting dashboard is a permission based feature that must be toggled on for users to be able to view the report data.
Like the saying goes, if you can’t report on it you can’t improve it. Instant access to good data creates actional opportunities to reduce waste and improve efficiencies. For more information on BuildCentrix dashboard reporting or data visualization please email [email protected]. ■
By Joe Perraton


